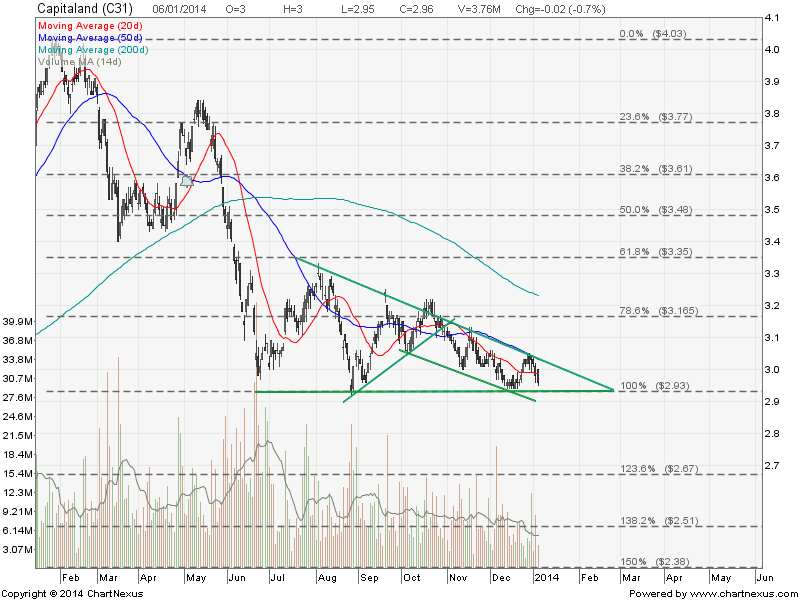
Capitaland is currently trading within a down trend channel (3 months) and within a Descending Triangle (6 months consolidation). Current chart is bearish as Capitaland is trading below all 3 SMA & sloping down. Watch the triangle support closely as breaking out from this level (about $2.93) will send Capitaland to the price target of $2.60. Immediate resistance at $3.00 (psychological resistance & triangle resistance).
Original post by Marubozu @ My Stocks Investing Journey.
| CURRENT P/E RATIO (TTM) | 12.9825 |
|---|---|
| ESTIMATED P/E(12/2013) | 18.9744 |
| RELATIVE P/E VS. FSSTI | 0.9738 |
| EARNINGS PER SHARE (SGD) (TTM) | 0.2280 |
| EST. EPS (SGD) (12/2013) | 0.1560 |
| EST. PEG RATIO | 0.6938 |
| MARKET CAP (M SGD) | 12,586.06 |
| SHARES OUTSTANDING (M) | 4,252.05 |
| 30 DAY AVERAGE VOLUME | 6,954,534 |
| PRICE/BOOK (MRQ) | 0.7923 |
| PRICE/SALE (TTM) | 3.1460 |
| DIVIDEND INDICATED GROSS YIELD | 2.36% |
| CASH DIVIDEND (SGD) | 0.0700 |
| DIVIDEND EX-DATE | 05/03/2013 |
| 5 YEAR DIVIDEND GROWTH | -10.84% |
| NEXT EARNINGS ANNOUNCEMENT | 02/21/2014 |
No comments:
Post a Comment