Market Sense

DISCLAIMER

The information contained in this publication / this website is provided to you for general information only and is not intended to nor will it create/induce the creation of any binding legal relations. The information or opinions provided do not constitute investment advice, a recommendation, an offer or solicitation to subscribe for, purchase or sell the investment product(s) mentioned herein. It does not have any regard to your specific investment objectives, financial situation and any of your particular needs. Accordingly, no warranty whatsoever is given and no liability whatsoever is accepted for any loss arising whether directly or indirectly as a result of any person or group of persons acting on this information. Investments are subject to investment risks including possible loss of the principal amount invested. The value of the product and the income from them may fall as well as rise. You may wish to obtain advice from a financial adviser before making a commitment to purchase any of the investment products mentioned herein. In the event that you choose not to obtain advice from a financial adviser, you should assess and consider whether the investment product is suitable for you before proceeding to invest. Any views, opinions, references or other statements or facts provided in this blog/website are personal views and shall disclaim any liability for damages resulting from errors and omissions contained.

CK Choy.

Market Sense 市场意识: June 2013
Be decisive, Be patient, Don’t be greedy, Don't be stubborn

Disclaimer

如果要翻译这个网站,请使用google translate http://translate.google.com

The information contained in is provided to you for general information/circulation only and is not intended to nor will it create/induce the creation of any binding legal relations. The information or opinions provided do not constitute investment advice, a recommendation, an offer or solicitation to subscribe for, purchase or sell the investment product(s) mentioned herein. It does not have any regard to your specific investment objectives, financial situation and any of your particular needs. Accordingly, no warranty whatsoever is given and no liability whatsoever is accepted for any loss arising whether directly or indirectly as a result of any person or group of persons acting on this information. Investments are subject to investment risks including possible loss of the principal amount invested. The value of the product and the income from them may fall as well as rise.

You should seek advice from a financial adviser regarding the suitability of the investment products mentioned, taking into account your specific investment objectives, financial situation or particular needs, before making a commitment to purchase the investment product. In the event that you choose not to obtain advice from a financial adviser, you should assess and consider whether the investment product is suitable for you before proceeding to invest.

Any views, opinions, references or other statements or facts provided in this are personal views. No liability is accepted for any direct/indirect or any other damages of any kind arising from or in connection with your reliance on the information provided herein.

Personal Data Protection Act (PDPA)
You would like this website to collect your personally identifiable information that can be used to contact or identify you (“Personal Data”). Personal Data may include, but is not limited to:
- Your name, email address and phone number.
You acknowledge and consent to our collection of your personal data for contacting you on the purposes listed below:
- Marketing, advertising and promotional purposes related to the content of this website
- Provision of products & services which you have requested for
Please note that you are entitled to withdraw your consent for the collection of your personal data at any point in time by providing a notification to ckchoy77@gmail.com.

Note:
All TA (Technical Analysis) view using charts are for illustration purpose only.
Unless otherwise specified, all charts' sources are from POEMS(Phillip Online Electronic Mart System)

Sunday 30 June 2013

Top 10 REITs and Property Business Trusts in Jun 2013

by Alvin
I have ranked the REITs and Property Business Trusts listed in Singapore by 3 criteria.
  1. Price/Net Asset Value
  2. Dividend Yield
  3. Debt-to-Equity Ratio
The results are documented here:

How to use the sheet?

The sheet serves as a guide to help you to find value-for-money REITs. It is not a recommendation to buy the top 10 REITs in this list. The top 10 REITs are those which ranked well in all three criteria mentioned above. You can take another step to review if the individual REIT fits your investment needs. Is the Price/NAV below 1? Or even lower? Is the dividend yield acceptable to you? How about the leverage? Is it too high for your comfort?
I hope the ranking can help you focus on the right REITs. You are a busy person and I know that. Instead of looking through all the REITs, you can save time by examining the top 10 or even just the top 3.

My View on REITs

REITs have tumbled down in price after the Fed talked about stopping QE3. Many feared the interest rates would go up and leveraged companies like REITs will be affected the most. I do not want to predict the future and I do not know when the Fed will pull the plug, or even if they will. Focusing on the valuations now, the REIT sector has an average Price/NAV of 1. This means that REITs are fairly valued. Secondly, dividend yield is about 5.74% which is decent but not impressive. Thirdly, the debt-to-equity ratio averaged 63%, which is on the high side but not at risky levels.
I believe there is room for the REITs to go up in price but personally, I will not participate at these prices since there isn’t any clear discounts.
- See more at: http://www.bigfatpurse.com/2013/06/top-10-reits-and-property-business-trusts-in-jun-2013/?utm_source=rss&utm_medium=rss&utm_campaign=top-10-reits-and-property-business-trusts-in-jun-2013#sthash.ic9AhRlF.dpuf

Gabriel Gan : Attempting To Grasp A Whole New World Without Cheap Money!

 28 JUNE 2013
Attempting To Grasp A Whole New World Without Cheap Money!
By Gabriel Gan

A fortnight ago, we witnessed the worse correction in more than a year after Fed Chairman Ben Bernanke breathed words of a gradual withdrawal of stimulus measures. Already so used to life in the stock market with cheap money, investors sold shares, bonds and gold so much so that buyers who had missed the entire rally refused to bargain hunt.

When Bernanke came out to utter comforting words, the stock markets rallied believing that it was a miscommunication that had led to the selloff. The Dow Jones Industrial Average (DJIA) attempted a rally from below 15,000 to as high as 15,340 before falling again when Ben Bernanke, in his post-FOMC meeting media conference, confirmed that the Fed would reduce the amount of bond-buying this year followed by a total withdrawal of Quantitative Easing (QE) III by mid of 2014 should the US unemployment figure hit 7 percent.


This rattled investors into selling as the DJIA plunged from a high of more than 15,300 before the Fed meeting to as low as 14,551 in a matter of just three trading days. The 800-point swing is still considered mild when compared to other markets, especially China and Hong Kong.

From peak to trough in the month of June alone, the Shanghai Composite Index (SSE) lost almost 450 points – a whopping 19.4 percent – and would have fallen into the bear market if not for the strong intra-day rebound on 25 June when it recovered from 100 points down to close at 1,959! If we were to take the closing of 2,421 points on 18 February and compare it against the close on 26 June, then the index is precariously close to a bear market. If the index breaks 1,936 points, then the index would have lost 20 percent from the high of 2,421 points.

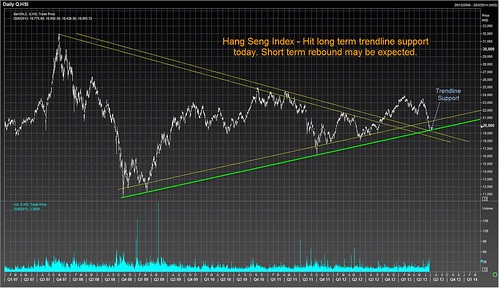
As for Hong Kong, the Hang Seng Index (HSI) reached a high of 23,685 on 4 February and fell all the way to 19,855 on 25 June, representing a monstrous 3,830-point drop or 16.1 percent. From the recent closing high of 23,493 on 20 May, the index fell 3,053 points to close at 20,440 on 27 June. While the HSI has yet to fall into bear market territory, it is also dangerously close to that level despite a rebound that started on 25 June.

Why The Correction?

There are two main factors that contributed to the correction: Firstly, the world is very used to government intervention in the financial markets so much so that we can safely attribute the 4 1/2 year Bull Run to an unprecedented amount of money being printed by the US central bank.

A lot of money has been printed but it does not seem that much has gone to help the economy outside of the financial markets. Money that has been printed has been used to buy up bonds, stocks but precious little has been invested in the real economy. The main aim of the stimulus measures has been to artificially deflate interest rates so that credit is available cheaply to those who need it although those who really need it do not have access to such funds. When so much money is in the financial system, funds are then parked in assets from silver to gold to stocks and bonds. Investors who are tired of the miserable returns on risk-free deposits are forced to seek higher returns via riskier assets. The appetite for risks has helped to fuel a Bull Run despite the economy not doing spectacularly well.

This has changed, and will change very soon after Ben Bernanke’s latest comments. The Fed chief has finally decided to stop serving alcohol and investors who have been in a drunken stupor all these while have finally sobered up and realised that we are facing a whole new world.

This whole new world has been made worse by the fact that China – the fastest-growing economy in the world for the last decade – will no longer be growing at the same pace and may not even grow at the pace anticipated by China’s government.

The sudden credit crunch in China has led to a sharp rise in the interbank borrowing rate, pushing up interest rate amid an environment where the government continues – and will continue – to drain off money supply in the financial system after learning its lesson in the previous stimulus exercise whereby inflation shot to the sky.

The key reason for the stock market’s weak performance was largely due to the fact that investors had earlier expected the new leaders to boost the economy but, instead of meeting expectations, Premier Li Keqiang decided to restructure the economy by relying less on exports, boost domestic consumption and wean the economy off its reliance on readily available credit that proved to be detrimental to the economy in the long run.

Now that US is readying itself for life without stimulus and China adapting to a whole new world of economic restructuring and slower growth, it will take the wind out of the sails of the stock market for quite a while until investors adapt to the paradigm shift. This paradigm shift, while painful in the short-term, is actually a positive for the global economy as a whole because the world cannot be surviving more printed money and ballooning national debts.

When the real economy is ready to stand on its own feet without crutches provided by stimulus measures, it will ultimately benefit the stock market. This is the time when economic growth is real and solid, backed by fundamentals and probably more consistent with reality.

Key Supports And Resistances

If we were to look at the DJIA, it does not seem that the impending end of QE III has done much harm. After falling to a low of 14,551 – the new support level for the DJIA in the near-term – the index is now at 15,024 points. It has met a minor resistance at the 9-day moving average and unless the index can move above 15,300, investors should not bet on the DJIA moving into a new uptrend.

While the US market looks rather strong despite it being the “epicenter of the earthquake”, Asian markets have suffered the most

For China and Hong Kong, they almost fell into bear market territory but are now enjoying a good spell after the People’s Bank of China acted to ease the credit crunch by injecting liquidity into areas where money is needed. It is also helped by certain Fed officials who are quick to downplay Bernanke’s earlier stance that QE III will be reduced by this year and put to a stop by next year. These officials quickly reassured that Bernanke’s statement was meant to say that QE III will end only if the economy was strong enough to stand on its own.

The HSI has staged a V-shaped rebound and continues to rise on 28 June after the DJIA staged a triple-digit rebound. The index may face some resistance at between 21,000-21,200 after rallying for a couple of days and owing to the weak sentiment. Support remains at the recent low of 19,426 points.

The weakest rebound took place in Singapore with the STI rising very little from its recent low and the overall market weak. It is unlikely that the index can go above the recent high of 3,235, as it is already struggling to overcome the resistance zone at between 3,150 to 3,180.

It will take time for the world to get used to slower growth and, most importantly, life without a stimulus measure. We cannot be sure that once the stimulus measures have been withdrawn, the economy can stand on its own but, as already mentioned, it is for the long-term good.

Source/Extract/Excerpts/来源/转贴/摘录: http://www.sharesinv.com/
Publish date: 28/06/13

Wednesday 26 June 2013

胡立阳:QE退场四部曲

过去一个多月来,我不断在许多论坛中预告QE若退场,必将造成全球股市大跌。但也有一些来宾提问:QE退场,表示美国经济正在复苏,股市不该下跌。这种说法表面听来,似乎有理。 但他们却忽略了,股市早已提前经济反应了。再说,华尔街股市,这二、三年来的暴涨,走的是资金行情,与经济发展完全脱钩,否则以不到2%的GDP,怎能扛起15,000 点的道指?过去,我曾研究近半世纪来,当全球资金由松转紧时,常会出现几个连锁反应,以下就是我在每场演讲会中说明的图表,现在也提供给大家作个参考:


胡立阳:QE退场四部曲


Source/Extract/Excerpts/来源/转贴/摘录: 腾讯财经
Publish date: 21/06/13

Hang Seng Index

Hang Seng Index

hangseng 25 jun

Sunday 23 June 2013

Lessons Learnt as an Investor (so far) Part 1

I have been doing “Lessons Learnt as a Trader” series, but now since I have been investing, I should start a series for investing lessons so as to document and consolidate my learning journey.

Buy low and sell high
To make money, one has to buy low and sell high. This is a simple principle that people claimed to know but how many people really understand the meaning? When the market crashes badly, and stock prices are rock bottom, it would be the best time to buy stocks. But how many people have the courage to buy? When market is rising and they see their peers making money, they have the impulse to buy and join the “winning” crowd even though the stock price has risen a lot. In actual fact, people buy high, and sell low after the market crash. The key is to buy low, low enough that it is so difficult for the price to go lower, and much easier for the stock price to go up, making your portfolio profitable most of the time.
Supply and demand
In free markets, prices are determined by demand and supply, this goes the same for the stock market. The number of stocks remains more or less the same, unless the company issue bonus shares, rights issues, and share buybacks. We can only play around with this amount of stocks. The supply would refer to the sellers while the demand refers to the buyers. The demand and supply come from institutions, funds, traders, investors and retail investors, buying and selling with one another. Only when demand meets supply, a price is agreed and shares are being transacted. In a bull market, demand is high and drives up stock prices. There would also be less people wanting to sell. Higher stock prices would further induce more demand, and driving prices higher. It is until a point where demand dries up, there will only be supply (sellers). With more supply than demand, prices have to fall. Discerning the demand and supply in the stock market is key to timing the market. To buy low, demand must be low.
Patience
The problem with buying low is the ability to hold the stocks for a period of time. This can mean a few years without seeing any profits. You would have to wait until more people are interested in these shares and push up the prices. Do you have the patience to buy low and early? If not, selling the stocks prematurely would jeopardize your profits. Patience is also critical during a market correction. We know that even stock prices do not go up in a straight line during a bull run, they move 3 steps up and 2 steps down. You must also have the patience to hold through a correction. And when market is euphoric, you may be tempted to buy stocks since making money would be easy. But you have to remain rational and not buy any stocks in such market condition. In fact, you must look for signals to sell. Patiently stay in cash till the market crashes. As you can see, patience allows you to remain rational and do opposite to what most irrational investors do.
Posted in: Nature of Financial Markets

What value do traders and investors contribute?

Do traders and investors add value to the society, or at least the financial ecosystem? In order to make money, one must provide value. If there are traders and investors out there that make money, there must be value that they contributed. I could think of 5 contributions.

Bring prices closer to ‘true value’
Instead of believing the market is always efficient, investors and traders buy and sell to price the market as efficient as possible. Most of the time, traders are able to move price closer to the true value. But when the orders become overwhelming, that is where the market goes out of whack. No hedge fund or bank would be able to fight against the crowd in unison.
A value investor will look for an asset that is priced lower than the ‘true value’. So by buying the assets, the demand he created signals the market that the price is wrong and it has to go up. Likewise for traders, they will be rewarded for getting the asset back to the true value over a shorter horizon, by altering the supply and demand in the market.
Help society allocate resources
Companies need funds to expand their operations. One of the ways to raise money is to be listed and sell part of the companies to investors. Investors who see potential in the company would provide resources (money) to the company to grow. This is also true for commodities. Suppose more and more people are moving into the cities to work in office and there is a declining trend in farming. Production of crops, let’s say corn, reduced. Over the years, supply of corn drops and demand would increase due to population growth. Traders and investors who sees the trend would buy corn contracts and the demand will drive the corn prices up. The rise in corn price will encourage farmers to produce more corn, until the supply matches the demand and price would stabilize.
Improve liquidity
A transaction requires a buyer and seller to agree on a price. Traders and investors provide a ‘service’ by being the counter-parties. With a good pool of buyers and sellers, the marketplace become vibrant and it is easy for a buyer to find a seller and vice versa. The exchange is able to match buyers and sellers of different contract sizes and transact as much as possible. Imagine we have person A who wants to sell 5,000 shares, person B wants to buy 7,000 shares, and person C wants to sell 2,000 shares. Person B can buy from both person A and C. This is a simplified example and as more traders and investors participate in the market, the easier for the transactions to go through.
Liquidity also means that the spread between buying and selling assets will narrow. Spread is the difference between the buy price and sell price.
Transferring risks
By buying assets, traders and investors are assuming risks. Just like insurance companies, they guarantee a sum of money upon deaths. They took on the risk and we are willing to pay them for that. Especially in commodities, producers and consumers do not like the uncertainty of future prices. As such, they use futures contracts to lock in the prices for the future delivery of commodities. Traders and investors would assume the risk of uncertainty and get rewarded if they are right and lose money when they are wrong.
Provide livelihood for the financial industry
Today’s financial industry has become sophisticated. It takes great cost to run a complex system. Traders and investors, through the buying and selling of assets, paying the transaction costs, help to support this financial industry. Without transactions, the financial industry cannot sustain an extensive number of brokerage firms and operations.
What other values do you think traders and investors contribute? Or do you think that traders and investors do not contribute at all?

What do the Economists Lie to You About Demand and Supply?

A BFP reader emailed me about an article talking about Price being the determinant of future prices of a security. Textbooks and economists have taught us that price is determined by the level of demand and supply. But there is more to it and the reader was kind enough to share with me his experience why aggressiveness can change the entire price dynamics of a security.
I believe price moves not just because of imbalance between demand and supply. The open auction market (covers anything that traded in the open from stock to pork bellies and orange juice) is nothing but a game of “power struggle”. Buyers struggle with sellers. Just like in animal kingdom, the strongest will overcome the weaker one. Imagine this. How can one lion scare off hundreds of zebras? The zebras outnumbered the lions by a massive margin. The lion only has one edge, it is more aggressive. Its aggression puts it in a position of advantage.
I encountered this simple phenomenon when I traded for institutional investors. I can have order size equivalent to the average daily trading volume of a blue chip. I have the firepower to hold the price and swing it any how I like. However, most of the time, the modus operandi is just to pace the market and just be 25%-33% of market volume. By limiting myself to just a quarter of market volume, I have surrendered my aggressive factor to the seller or to the other buyers. Many a times, theres more demand than theres supply but the price still goes lower. I know because I have had the experience of selling or buying up to 5% of a blue chip company. I have the firepower to take on the sellers single handedly. That set me thinking that price moves in the direction of the most aggressive. If seller is more aggressive, the price will drop. If buyer is more aggressive, the price will rise. By buyer and seller I dont mean a single entity. I mean a group as a whole. Those buying form the buyers group and those selling form sellers group. Lets now see how this mechanism work.
All buyers and sellers have one aim in mind: to further their interest in the auction. If I am selling, I want to sell it high and if I am buying, I want to buy it low. So naturally I don’t want to be aggressive. I want the buyer to be aggressive so I may sell at higher price. Now, the buyer have the same thing in mind. He wants the seller to be aggressive because he wants to buy lower. None wants to budge right? If that is so, how can a trade be done? However, lets’ say another buyer steps in and his price is higher and more gung ho and he outbids the first buyer, the whole dynamic has changed. There’s a power struggle not just between buyer and seller but also between buyer 1 and buyer 2. Competition raises aggression and as price move higher it attracts more buyers. Suddenly it becomes a feeding frenzy. Price spirals higher not because buyers were fighting seller, but because buyers were fighting among themselves, each shuffling to buy before the price runs away.
Now you say, there’s more buyer therefore more demand and thus price goes up. Not true. A trade can only be done and price printed when buy quantity matches sell quantity at an agreed upon price. So at any one time, demand=supply when a trade is done. Therefore, the level of aggression of each party (buyer or seller), governs by the level of competition in the game within each camp. If the buyers are more competitive, they become more aggressive the price goes up and when the sellers are more competitive, the price goes down.
I have shared with you my experience with large orders but sedated aggression. Now I have also the experience with small orders but maximum aggression. I remember buying stocks with only 300+k shares in order size. The stocks trades millions per day. My order size was nothing. The stock has not gone anywhere. There was a gridlock between buyers and sellers and between the buyers and sellers themselves. It has not moved the whole day. My client wanted to finish the order early and he was comfortable with the prevailing price. So I lifted the offer and again the next offer to complete the order. The other buyers panic because they missed 2 prints so they decided to be more aggressive. Before I know it, a feeding frenzy got into action and price rallied. What I did was to introduce competition. Competition leads to aggression leads to price movement. More buyers does not mean higher price as there might not be competition.

投資導航:三大凶兆推冧樓市

調查發現,過去一年本港樓價勁升28%,冠絕全球,近期全城瘋搶居屋,令樓市乍現一片繁華景象。不過,在熱鬧的背後,樓市卻已隱藏三大凶兆,包括地產股小股災、美國國債息率趨升,以及一、二手市場冰封,隨時殺市場一個措手不及,今期「投資導航」將剖析這三大因素,或將樓價只升不跌的神話打破。

【1】地產指數預示 樓價下跌成定局
【重要指標】

美國退市陰霾殺埋身,息口趨升,地產股近月瘋狂下跌,新世界(017)及美聯集團(1200)分別挫18%及20%最誇張,期內恒生地產分類指數(下稱地產指數)勁跌14%,大幅跑輸恒生指數約一成跌幅。值得留意的是地產指數與中原城市領先指數往往相互緊扣,地產指數更是樓價領先指標,其大幅下挫預示後者將跟跌,樓價或難再抵抗地心吸力。


■從地產股的走勢,可以估計樓市何時調整。


指數見底後樓價始調整
翻查往績,地產指數與樓價在2007至2010年的四年間,每年的關聯系數均高達0.7或以上(數值由1至-1,越接近1,正比關聯度越高),09年樓市大反彈,相關系數更加高達0.95。雖然走勢極之同步的現象在最近三年逐步減退,今年以來更出現-0.4的反比關係,但倘細心分析,會發現由於近年樓市調整的滯後情況越見明顯,凸顯地產指數的領先地位。

2008年金融海嘯一役,樓價自7月初起急速下瀉,一季跌足兩成,但地產指數其實早在兩個月前已開始調整,並早在樓價見底前半個月,已率先尋底,累計跌幅多近六成。而近年相關趨勢越見明顯,2010年11月底政府首次出招推出額外印花稅(SSD),地產指數旋即受拖累,及至翌年次季明顯見跌勢,往後兩季累跌近四成,相對樓價要再過兩個月後才見整固並回調,累計大半年跌幅約5%;另今年2月港府再推雙倍印花稅(DSD),地產股早在半個月前已反覆下瀉,累計兩個月跌逾一成,相反樓市調整卻滯後逾一個月,兩個月累計下跌不足4%。

【2】政府連環辣招 一二手交投慘淡
【缺乏動力】

雖然本港樓價仍在高位徘徊,但政府連環出辣招打壓樓市,加上一手銷售新例出台,一二手市場交投明顯受壓,地產代理固然冇啖好食,在交投欠奉下,樓價縱未下跌,卻已缺乏上升動力。

《一手住宅物業銷售條例》於今年4月29日生效,新例要求發展商須於樓價開售前最少七天派發樓書,並統一以實用面積計價,又表明不得發佈屬虛假或具有誤導性資料的廣告等。發展商為免誤踩地雷負上刑責,亦不敢輕舉妄動,部份更因新樓書資料有錯,推盤計劃要急煞停。恒地(012)及新世界(017)合作發展的元朗尚悅便是一例。上月底一手新例滿月時,成交量急插九成,與新例實施前的散貨潮,可謂南轅北轍,新盤明顯進入真空期。

二手市場慘況直逼沙士
政府在2月底時推出雙倍印花稅(DSD),令原來已不熾熱的二手市場雪上加霜,根據美聯物業引述土地註冊處數據顯示,3至5月二手成交量分別為3,546、2,404及3,078宗,較2月時的5,224宗成交,大減三至五成,慘烈程度直逼2003年沙士。中原地產創辦人施永青直指,政府辣招削減原有買家的需求,既未能幫助市民上車,更令樓價缺乏上升動力。特首梁振英卻重申,在新供應未到位下,政府不會放鬆調控需求力度。雖然近期居屋成交癲價頻頻,但施永青認為,居屋市場佔本港樓市比例小,難以帶動整體交投回升。

【3】美長債息飆 打擊入市意欲
【歷史重演】


美國長期國債孳息走勢,一向被視作市場資金成本的指標,由於港滙與美元掛鈎,對本港息口亦具啟示作用。

15年經歷三次調整
參考過去美國10年國債走勢,每當息率見底回升,進入上升周期之初,必打擊市民入市買樓意欲,樓價均出現調整,儲局密謀退市,美國10年期債息由低位回升至逾2厘水平,相信歷史正在重演。


1998年至今的15年間,美國10年期債息率共歷三次上升周期,1998年第四季息率由4.1厘,升至2000年初6.7厘水平,反映本港樓價的中原城市領先指數由1998年8月底的51.13,一度回落至同年10月中的48.27始回穩,短短數月回落幅度逾半成。債息第二個上升周期起自03年第三季至2007年中,孳息率由3.1厘升至5.3厘,中原城市領先指數由03年4月底33.25,跌至同年8月的31.77始回穩,跌4.5%。


美長債息第三個上升周期由2008年底至2010年初,孳息率由2厘升至近4厘,中原城市領先指數由08年7月的72.77,跌至09年初的56.78始回穩,短短半年樓價跌22%。今次美國10年債息率由去年1.4厘升至目標2.2厘水平,雖然同期中原城市領先指數由104.01升至今年3月中的123.45,曾急升19%,但最近已較高位回落2.2%,新一輪跌浪隨時啟動。

Source/Extract/Excerpts/来源/转贴/摘录: 蘋果日報
Publish date: 16/06/13

Sunday 16 June 2013

Gold : The analysis

It is Sunday morning ... Happy Father's Day to many great fathers out there. I wish to be a great father to my kids too. Yeah!!

Ok, this morning I will share what in my mind ... to buy into 'gold' related ETF or mining stocks. See how far I could focus to give some idea.


Gold : Taken from www.kitco.com, a one-year chart ... gold hit USD1800 (in Malaysia, Gold was trading above RM200 for 999) and current at USD1400.


GLD : This is an US-ETF tracking the prices of gold. Hit USD180 at Sept 2011(when markets corrected sharply) and at USD170 last Sept 2012. At USD135 levels now ... one may check IAU too, which was at a high of USD18.5(sept 2011) but at USD13.5 currently.


GLD (code O87) : This is traded in SGX ... but in USD. We are still in the strong downtrend.


HKSE (code 2840) : So the similar chart shown by this ETF, traded in HKSE.


ZhaoJin(code 1818) : Gold mining stocks are much more riskier ... and it can be seen in this gold-mining counter traded in HKSE. Incredible dive ... was at HKD18 high ... hit the low at HKD6.59, closed at HKD6.75 last Friday.

KLSE : There is no gold ETF traded in KLSE ... only one GLD-c4, a call-warrant trading at HALF cent, so it could not go lower? Punt into her, exit at ONE cent, that will be 100% profit, yeah? Sure? Call-warrants do have expiring date and if Gold not receovering any sooner, this call-warrant will be obsolete, means ... we will lose everything(very likely). How about SLV-cw ... which tracking the SLV-etf ... as silver-etf, tracking prices of silver? To me, these call-warrants can't be traded.

Will gold rebound soon, since Sept is nearing? Will stock dive again ... as Sept is nearing ... again?

Will write the updates ... in SEPT again.

Happy Day ahead, fathers.

TEH

恒指3周瀉3000點 反撲待下季

恒指3周瀉3000點 反撲待下季
夜期短線反彈238點 料下月始見底
2013年6月14日
【明報專訊】內地A股於端午節後復市即大跌,拖累國指連跌11天,平了1995年10月底的最長跌浪紀錄。恒指亦不遑多讓,早段隨外圍一度急挫700點,以昨日最低點計算,自5月20日恒指高見23,512點起計,3周已累計跌近3000點。投資界指出,美國收水預期、日圓回升及各國經濟數據不佳,三大因素繼續困擾後市,最快也要下個月才完成調整。

亞太區繼續爆發小股災,日本及菲律賓股市都跌逾6%,上證綜指復市後大跌2.83%。國指難逃厄運,再跌2.73%。恒指亦急插水,昨日跌467點至20,887點,較5月20日高位亦已跌逾2600點,昨天低位曾見20,652點。全日沽空率為12.4%,繼續處於高位,成交增至877億元。恒指期貨在夜市時段見反彈,收市報21,038點,較日間期指升238點。昨晚道指先跌後回升,截至昨晚11時報15,036點,升42點。匯控(0005)美國預託證券(ADR)報83.8元,較港收市升0.75元。


地產股低位反彈 匯控美升0.75元

中資金融股昨日全線下跌,建行(0939)除息後再跌3.2%,資源股普遍下挫,但本地地產股在低位反彈,部分更倒升收市,帶動恒指收市跌幅收窄。豐盛資產管理董事黃國英指出,除地產股外,房託基金及公用股亦在低位有承接,若以長線投資為主,可考慮吸納。

匯豐:10月三中全會推改革 利反彈

回顧過去10年,恒指在5月及6月往往經歷跌市,並在7月回升,8月再度調整後,第四季普遍向好(見表)。早前匯豐的報告便指出,內地10月舉行三中全會,屆時可能推出各項改革,令股市向上突破。昨日投資界亦給出各項原因,預言股市在下半年才會反彈。

摩根資產管理市場策略師譚慧敏指出,過去數年市場都預期美國會結束量化寬鬆政策,但一直沒有明顯的調整,所以今次調整的幅度將比前兩次大,可能要到8月才大致消化這因素。她強調,該行不急於買貨,現時股匯債都下挫,持現金才是上策。建銀國際研究部董事總經理蘇國堅認為,過去數月很多人借日圓買美股或其他高息資產,因此只要日圓繼續走強,股市拋售潮都尚未完結,「待基金在6月底年結後,平倉活動完結,才有望扭轉劣勢」。

恒生:待經濟數據10月好轉

恒生投資服務公司首席分析員溫灼培指出,近期跌市元兇是經濟數據差,「上月底公布的歐元區首季經濟增長及本月初公布的5月份美國製造業指數都令市場失望」,他指出,亞太區尤其是中國都依賴出口,歐美經濟復蘇不達標影響投資者的預期,估計第三季數據好轉,投資氣氛才會好轉。

明報記者 廖毅然
關閉本視窗

Source/Extract/Excerpts/来源/转贴/摘录: 明報
Publish date:14/06/13

Wednesday 12 June 2013

Trading in the Zone by Mark Douglas

Trading in the zone

This book is one of the favourites for traders. I have heard enough stories about how this book has helped traders make the necessary mental shift to become profitable traders. Instead of believing in what others said, I read the book and judged it for myself. I will not say that it had such a fundamental impact to me but I cannot deny the book did helped me figure out certain things in trading. Not everyone can pick up the same amount of useful ideas from the same book. Different people have different background, experience and objectives, and are triggered by different thoughts. Although I may not have gotten a lot from it, it does not mean you would not. Nonetheless, I enjoyed the book and being able to get a few perspectives from it still makes it a good book. I shall share with you two things that I have learned.

More Knowledge Does Not Prevent Losses

I was guilty about a mistake that Mark pointed out in the book – I lose money because I lack market knowledge. To him, it is not true.
“This means that no matter how much you learn about the market’s behavior, no matter how brilliant an analyst you become, you will never learn enough to anticipate every possible way that the market can make you wrong or cause you to lose money.”
He said that losses are not a result of your reading of the market. No one can learn enough to score 100% wins in all his trades. Hence, it is never about being the super analyst who never make any mistake. This person does not exist.
“Why do you think unsuccessful traders are obsessed with market analysis. They crave the sense of certainty that analysis appears to give them. Although few would admit it, the truth is that the typical trader wants to be right on every single trade. He is desperately trying to create certainty where it just doesn’t exist.”
“The consistency you seek is in your mind, not in the markets. It’s attitudes and beliefs about being wrong, losing money, and the tendency to become reckless, when you’re feeling good, that cause most losses – not technique or market knowledge.”
Hence, do not expect your methods or the market to perform consistently. Do not be disappointed when you are wrong, or become overconfident when you are right. It is about implementing your method consistently regardless of wins and losses. Because wins and losses will stir your feelings and cause you to act irrationally, and result in self-sabotage.
“To be consistent, you have to learn to think about trading in such a way that you’re no longer susceptible to conscious or subconscious mental processes that cause you to obscure, block, or pick and choose information on the basis of what will make you happy, give you what you want, or avoid pain.”
I think the above quote is true – we see what we want to see. We filter information every second and we do that in trading too. We will filter out the information that will cause us pain and select information that gives us pleasure. And doing these seldom lead us to profits.

Why People Love Trading?

I love the way Mark explained why people love trading, and I think to some extent I felt it is true for me.
“Trading is an activity that offers the individual unlimited freedom of creative expression, a freedom of expression that has been denied most of us for most of our lives.”
However, he cautioned that many of us do not have the necessary psychological makeup to survive the market when we have no rules to govern our trading in the boundless market.
“The freedom is great. All of us seem to naturally want it, strive for it, even crave it. But that doesn’t mean that we have the appropriate psychological resources to operate effectively in an environment that has few, if any, boundaries and where the potential to do enormous damage to ourselves exists. Almost everyone needs to make some mental adjustments, regardless of their educational background, intelligence or how successful they’ve been in other endeavors.”
——————————–
These are the two things that were most applicable to my situation. Have you read the book? What were the useful things you have gotten out of the book?
- See more at: http://www.bigfatpurse.com/2013/06/trading-in-the-zone-by-mark-douglas/?utm_source=rss&utm_medium=rss&utm_campaign=trading-in-the-zone-by-mark-douglas#sthash.kPTgmU3p.dpuf

Sunday 9 June 2013

May 2013 Month Global PE Ratio

Worldwide Major Indices PE June2013

8 Key Financial Ratios That Value Investors Absolutely Must Know


Value Investing is nothing fanciful. The problem is that there are too many financial ratios to confuse the investors. The key is to look at the right ones. Study enough to make an informed decision to buy and sell. There is no point listening to too many opinions or over-analyse a company and end up taking no action because the signals are contradicting one another. To help you, I have list down 8 key financial ratios that you, as a value investor, must know.

#1  - Price-Earnings

PE ratio is the most common financial ratio to investors. The numerator is the price of the stocks while the denominator is the earnings of the company. This means that how many times of earnings are you paying for the stocks. For example, if the PE is 10, it means that you are paying 10 years worth of earnings. The lower the PE, the better. Let’s use an example to illustrate this. You saw a house selling for $1m and the owner said it is tenanted. The owner tells you the rental is worth $5k a month. After you have factored all the costs in owning and maintaining the house, your net profit is $2k a month or $24k a year. So the PE ratio for the house will be about 42. It will take 42 years for you to get back the worth of the house through a positive cashflow of $2k per month.
Although PE is a favourite ratio, it is ever changing. Firstly, price can change. No one can predict how high the stock prices can go and although the PE can be high in your opinion, it can continue to go higher beyond your imagination. The other factor that causes PE to change is the significant rise and fall in earnings. A company can be making a lot of money for the past 10 years but because of competition, they may lose market share and suffer a decline in earnings. Hence, PE ratio is at best a view of the company’s and its stock’s historical performance. It does not tell you the future. You would need to assess the quality aspect of the company – Can it sustain it’s earnings? Will the earnings grow?

#2 – Price / Free Cash Flow(FCF)

There is a belief that while it is possible to fake the income statement, it is harder to fake cash flow.  Hence, besides looking at the PE ratio, you can examine the P/FCF Ratio. FCF is calculated based on the values from the cash flow statement, which the statement shows the movement of money in and out of the company. FCF is defined as, Cash Flow from Operations – Capital Expenditures. If the number is positive, it tells us that the company is taking in more money than it is spending. And it often indicates a rise in earnings. PE and P/FCF should tell the same story. You can use either or use both to detect any anomaly/divergence.

#3 – Price Earnings Growth Rate (PEG)

We recognise the deficiency of PE ratio which is plainly historical performance. Is there a better way to look into the future to get a sense if the company is a good buy? The house example assumed the rental does not grow over time. But you and I know that it is not totally true. Rental may go up due to inflation. Likewise, growing companies are likely to increase their earnings in the future. One of the ways to factor this growth is to look at PEG ratio. It is simply PE / Annual Earnings Per Share (EPS) Growth Rate. Yes, it is a mouthful. I will explain the denominator. EPS is simply earnings divided by the number of shares. But we need to look at the growth of earnings. So we have to average out the growth in EPS for the past few years. For example, if the company has been growing at a rate of 10% per year, and its PE is 10, the PEG would be 1. In general, PEG ratio less than 1 is deem as undervalued. However, it is important to understand that we are ASSUMING the company would continue to grow at this rate. No one can forecast earnings accurately. Warren Buffett is smart in this area because he buys into companies with competitive advantage. Only this way, he can be more certain that the earnings will continue to grow, or at least remain the same.

#4 – Price-to-Book or Price-to-Net Asset Value

PB ratio is the second most common ratio. Some people call it price to net asset value (NAV) instead. Net asset is the difference between the value of the TANGIBLE assets the company possessed and the liability the company assumed (intangible assets like goodwill which should be excluded). Let’s revisit the house example. Your house is worth $1m dollars and you owe the bank $500k, so your net asset value of the house is $500k. Hence, the higher the net asset value, the better. If the stock’s PB ratio is less than 1, it means that you are paying less than net asset of the company – think along the lines that you can buy a house below market value.
There is a word of caution when you look at NAV. These numbers are what the companies report and they may overstate or understate the value of assets and liabilities. In fact, not all assets are equal. For example, a piece of real estate is more precious than product inventory. Rising inventory is a sign the company is not making sales and earnings may drop. Hence, rising assets or NAV may not always be a good thing. You have to assess the asset of the company. The worst assets to hold are products with expiry, like agricultural crops etc. Also, during property booms, the assets may go up significantly as the properties are revalued. The NAV may tank if the property market crashes.

#5 – Debt-to-Asset or Debt-to-Equity

Sometimes I wondered if I should be looking at Debt-to-Asset (D/A) or Debt-to-Equity (D/E) ratios. After a while, I realised either one of them is fine because both are just trying to measure the debt level of the company. Most importantly, use the same metric to make comparisons. Do not compare a stock’s D/A with another stocks’s D/E! Let’s go back to the example of your $1m house and remember you still owe the bank $500k, what would your D/A and D/E look like? Your D/A will follow the formula, Total Liabilities / Total Assets, which will give you a value of 50% in this case (assuming you only have this house and no other assets or liabilities for the sake of this example). Your D/E, which is defined as Total Liabilities / Net Asset Value, will give you a value of 100%. Hence, for D/A at 50%, it should mean something like this to you: 50% of my house is serviced through debt. And for D/E at 100%, you should read it as: if I sell my house now, I can repay 100% of the debt without having to top up.
As you can see, it is just a matter of preference and there is no difference to which ratio you should use. Most importantly, the value of D/A or D/E is to understand how much debts the company is assuming. The company may be earning record profits but the performance may largely be supported by leverage. You should not be happy to see D/A and D/E rising. Leveraged performance is impressive during the good times. But during bad times, companies run the risk of bankruptcy.

#6 – Current Ratio or Quick Ratio

Long term debts usually take up the majority of the total liabilities. Although the company may have a manageable long-term debt level, it may not have sufficient liquidity to meet short term debts. This is important as cash in the short term is the lifeline of a business. One way to assess this is to look at the Current Ratio or Quick Ratio. Again, it does not really matter which one you are looking at. In investing and in life, nothing is 100% accurate. Close enough is good enough. Current Ratio is simply Current Assets / Current Liabilities. ‘Current’ in accounting means less than 1 year. Current assets are examples like cash and fixed deposits. Current liabilities are loans that are due within one year. Quick Ratio is, Current Assets – Inventory / Current Liabilities, and it is slightly more stringent than Current ratio. Quick ratio is more apt for companies that sell products where inventory can take up a large part of their assets. It does not make a difference to company selling a service.

#7 – Payout Ratio

A company can do two things to their earnings: (1) distribute dividends to shareholders and/or (2) retain earnings for company’s usage. Payout ratio is to measure the percentage of earnings given out as dividends. You will understand how much the company is keeping the earnings and you should ask the management what do they intend to do with the money. Are they expanding the business geographically or production capacity? Are they acquiring other businesses? Or are they just keeping the money without having knowing what to do with it? There is nothing wrong for the company to retain earnings if the management is going to make good use of the money. Otherwise, they should give out a higher percentage of dividends to shareholders. This is a good ratio to question the management and judge if they really care about the shareholders.

#8 – Management Ownership Percentage

This is not a financial ratio per se but it is important to look at. It is unlikely the CEO or Chairman would own more than 50% of a large corporation. Hence, this is  more applicable to small companies. I like to buy into small and profitable companies where their CEO/Chairman is a majority shareholder. This is to ensure his interests are aligned to the shareholders. It is natural humans are selfish to a certain extent and if you have the CEO/Chairman having more stake in the company, you are certain he will look after you (and himself).

Where to find these ratios?

You do not need to calculate all these values yourself! There are websites which have done the service for us. Some are free and some are paid. My advice is try the free ones first and if it is not sufficient, then pay for more information. The following are some of the sites you can consider:
Singapore Stocks
U.S. Stocks
There you go. 8 Key Financial Ratios in a nutshell and some websites for your reference. Let me know what other websites provide such fundamental data. Share the good stuffs with us!

Monday 3 June 2013

Are You Investing In The Right Trust?

31 MAY 2013
Are You Investing In The Right Trust?
By Ong Qiuying and Choo Hao Xiang

Are You Investing In The Right Trust?

The hunt for yield has spurred a bull market in Singapore-listed trusts. While trusts have generally been perceived to be stable yield plays, share price performances of business trusts had not able to keep pace with that of its other akin investment vehicle – real estate investment trust. Are investors of such trust in danger of being left behind?

Roughly one decade into the introduction of the first trust, numerous trusts have found their way onto the Singapore Exchange. Looking at the past 12 months, trusts made up a quarter of 23 new listings on the local bourse.


The intriguing fact about these new trust listings is that majority is in the form of a business trust structure. Despite the lacklustre performance of business trusts since listing, investors’ enthusiasm has not faded as seen in the recent public tranche offered by Croesus Retail Trust that was 48.8 times subscribed.

Are All Trusts The Same?
Established for the purpose of acquiring properties, business trusts and real estate investment trusts (REITs) are essentially cash-generating assets. The vehicle, which is created by trust deed, provides investors the chance to own a portion of the trust’s assets, be it infrastructure assets or retail malls, which would otherwise be inaccessible to retail investors.

The reason behind such a setup instead of a company lies in the capital intensive nature of the business and the expertise required to manage the assets. It also allows companies which pump assets into the trust to realise their investments and obtain recurring income such as management fees concurrently.

Another similar feature is the investment return. Apart from capital appreciation, returns from such investments would typically be accompanied by regular distributions. Unlike a company, these distributions are derived from cash flows rather than accounting profits.

Despite the similarities, business trusts are structurally different from REITs, which can be seen in the table below. Because of these differences, REITs and business trusts can have very different levels of risks.


To put the case in point, the gearing of a business trust can go beyond 100 percent. For both business trust and REIT that provide similar returns, a REIT with a gearing limit of 35 percent would be of a lower risk. Nonetheless, a high gearing level is not necessarily bad as the trust could expand much faster with more readily available funds. However, a business trust may also surprise their unitholders with changes to their payout in times of difficulties as it does not have a minimum payout policy like the REITs. Hence, it ultimately boils down to the risk tolerance of the investor and the individual’s investment goals.

So, REIT Or Business Trust?
This is perhaps the biggest question hanging over our heads. With yield plays the hot favourite in this low interest rate and high liquidity environment, much of the attention have been on REITs instead of the lesser known business trusts. It is not difficult to wonder why, given the REITs’ outstanding performance and business trusts’ lacklustre showing thus far. From the start of this year till 23 May, REITs recorded an average of 11.8 percent gains in share price while business trusts averaged 4.3 percent and stapled securities at 2.2 percent.

However, as newly-listed business trust Croesus Retail Trust cruised to post double-digit gains on its debut, one has got to wonder if the tide has turned for business trusts that were once surrounded by skepticism.

Performance Table On Business Trusts And REITs
Source: Compiled from information on the Singapore Exchange
*Yield for the period from company’s listing to its financial year end
Average computation excludes newly listed trusts in 2012 and 2013

Notably, there are also instances where business trusts outperform the REITs. To be specific, we take a closer look into Perennial China Retail Trust (PCRT) and CapitaRetail China Trust (CRCT), which are both operating in the China retail market. PCRT has recorded price gains of 6.2 percent as at 23 May and a dividend yield of 6.4 percent while CRCT’s shares have fallen by 3 percent over the same period with dividend yield of close to 6 percent. In this comparison, the outperformance by PCRT may be attributed to investors factoring in the potential growth PCRT have as it undertakes development properties while existing development properties turn income-producing.

That said, one noteworthy point is that the performance of a trust is largely dependent on its underlying business, quality of assets and operating business environment. Making references from the performance table, we can see the varying share price performances within business trusts that are grouped under real estate related and non-real estate related. The business trusts that are real estate related beat those that are non-real estate related hands down with a capital gain of 6.9 percent compared to 2.5 percent for the latter.

If you take a closer look at the trusts listed under the non-real estate related segment, you would also realise that they can be broadly classified as defensive or cyclical assets. And that is where a pattern emerges. Defensive stocks that are backed by infrastructure or healthcare assets are faring well while the same cannot be said about cyclical stocks. With the exception of Hutchison Port Holdings Trust, shipping trusts sank into negative territories, albeit the impact were mitigated by decent yields.

In addition to this distinctive classification, investors should recognise that the capital structure as well as business strategy employed play a huge part in determining whether expansion is an aim for the trust in the interim.

With that in mind, it pays to understand what each trust offer in terms of growth and yield. While the wider range of assets a business trust can hold may leave investors spoilt for choice, the need to take a selective approach still stands.


Source/Extract/Excerpts/来源/转贴/摘录: http://www.sharesinv.com/
Publish date: 31/05/13

Saturday 1 June 2013

颜子伟:更多危险信号出现:市场是否只会微跌或重大调整将会出现?

更多危险信号出现:市场是否只会微跌或重大调整将会出现?
文: 颜子伟 (译:麦美莹) 2013年05月31日 展望
所有一切皆因日经225指数而起,对吗?

对于那些被套住的投资者来说,自5月23日以来,日经225指数的暴跌成为了市场热话。自从日本经济掉入失落的十年后,许多投资者可能对日本股市已经避之则吉,但人们近日对它的关注比海啸摧毁核电站的消息来得更甚。

日本新一轮的牛市始于去年11月,它从11月16日的8,619点低位一直升高至5月23日的15,942点高位,在短短的6个半月里,升幅足足达到84.5%!


当自民党去年底重新执政前,市场预期自民党会取得胜利已经把日元推至新低及把股市推至2012年新高。但直至首相安倍晋三前所未有地向经济大量注资,同时让日元走低来刺激其出口后,好戏才正式上演。

无论如何,虽然央行请了一位支持刺激措施的行长,但他也像伯南克最初执掌联储局的时候一样,步步维艰。日本央行行长黑田东彦似乎在维持刺激政策及保持低利率的同时,与投资市场有点脱节,令日本政府债券的价格走低及获益率上升。

投资者开始质问刺激措施是否确实能够刺激日本经济,但不会令借贷成本升高。这样庞大的刺激措施存在着很大的疑问,因此,如果一旦计划未能奏效,效果不堪设想。

5月23日的暴跌虽然惊人,但它只占了从11月至今的8,000多点升幅的一小部份。可是,从图表来看,1,143点的跌幅是一个重要的逆转信号,因为日经225指数从走高变为狂跌。从15,942点高位跌至5月30日的13,555点低位,跌幅高达15%, 因此它不大可能在短时间内收复失地。

我们从每日图表中看到超卖情况,而每周图表显示的跌势更强。如果13,000 点失守,那么日经指数的升势就会终结。危险信号在5月30日增强,因为日经指数再蒙受737点跌幅,以13,589点收盘,并拖累亚洲其他股市收低。

只是微跌?
日经指数在5月23日狂跌时,大部份股市也相继下挫,但很快便回弹,尽管日经指数在接下来的几天继续下跌。当日经指数在5月30日下跌737点或5.5%时,恒生指数只下跌了70点,而上海综合指数仅跌了7点。欧洲及美国市场一点也没有受到日经指数的5.5%跌幅影响 ,因为它们在走高。

新加坡海峡时报指数则曾经一度跌超过60点至3,303点,但全日只下跌了31点,以3,336点收盘。更重要是海指在3,320点的关键支持位并没有失守,而在接近收盘时,海指从接近3,300点的心理支持位回弹。海指的跌幅不大全赖银行股的支持。大华银行(UOB)曾一度下跌0.77元至20.51元,但它之后回弹,收盘时只下跌了0.08元,报21.20元。同样地,星展集团(DBS)的股价曾一度下跌0.35元至16.77元,但收盘时只下跌了0.15元,报16.97元。

如果我们从整个抛售局面来看,我们可以说日本是始作俑者,因此目前的调整可以被视为轻微跌幅,但也可以被视为期待已久的急需调整。

警告信号!
从最近的经济数据来看,中国经济可能会即将出现另一次的放缓。制造业不景气;价格下滑;而中国政府不打算作出任何干预,不像前几年那样推出庞大的刺激措施。

新领导层表示不会采取大刀阔斧措施来刺激经济无疑令投资者感到失望,但它强调会把重点放在重组经济上,并会放弃上一届领导曾坚守的7.5%增长目标,而是把新目标定在7%。他们也会以国内消费作为新增长动力来替代出口。

中国的转变意味着传统的领域像房地产业(中国的房屋价格依然高企)将会继续受到监控,而一直备受压力的商品领域不大可能获得解救。从来宝集团(Noble Group)、奥兰国际(Olam International)、印多福农业(Indofood Agri Resources)及其他与商品相关股只的表现来看,便可见一斑。

随着中国经济在没有刺激措施推动下很可能放缓,而欧洲依然陷于衰退中,后者拒绝放弃紧缩措施(但已经有人提出有关要求), 环球的唯一增长动力依然是来自美国,因为在推出第三轮刺激措施后,劳工及房屋市场已经好转。基本上,这意味着美国投资者已经十分依赖刺激措施,甚至如果一旦缺少了政府的援助金,生活将成问题,而美国经济的复苏之路也会就此完结!

这刚好就是令投资者恐慌,决定抛售股票的原因,事实上,刺激措施令金融系统充斥资金,导致借贷成本大幅减低。股市全面上升及经济复苏主要是因为热钱充斥市场,因此如果没有热钱流入,形势将会急转直下。

当联储局在上一次会议开始讨论刺激措施时,他们实际上是讨论增加或减少回购债券的数目(他们在之前的会议中从未有这样讨论过),意味着联储局所用的言辞改变了一点。当然,站在联储局的立场(尤其是伯南克),他们为了要掩盖减少回购债券的可能性,而把增加的字眼也包含在内,但只是想想可能会缩减刺激措施,其实已经令投资者恐慌不已。

现在讨论全面取消刺激措施当然言之过早,因为目前的失业率仍很高。但当失业率下跌至7%,这个可能性会增加,而如果失业率跌至7%之下,这差不多肯定成事。

精明的投资者开始抛售10年期国库券一点也不令人感到意外。尽管联储局大量买入,这个投资工具的获益率升至一年来高位。这意味着投资者预期利率将会上升!我们不可以忽略这个趋势,就好像我们不可以忽略美元一直在走高,这与大量印钞及低利率会令美元贬值的日子有点背道而驰。

互相抵触的信号?
目前,我们差不多可以肯定近期的升势是因为大量热钱从市场流出流入所致,这说明了为何日经指数会大起大落。

我们可以埋怨日本出现的调整导致其他所有市场都出现反射作用。但只要热钱继续流入而中国及美国的经济继续稳守,市场不大可能出现崩溃,但这个情况只适用于未来3至4个月。

在第三季之后,有关美国刺激措施及利率的情况将会较为明朗。目前,我们需要留意债券获益率及美元的走势。甚至美国抵押利率从上个星期起提高,也会在长期上带来不利影响。


Source/Extract/Excerpts/来源/转贴/摘录: 新加坡股市资讯网
Publish date: 31/05/13